Defining the circularity indicators of a manufacturer
Case study
Context
An industrial equipment manufacturer has made the circular economy a core pillar of its strategy: parts reuse, remanufacturing, rental, and take-back of end-of-life equipment. This ambition is part of its 2030 commitments, and the CSRD now requires the company to report, under ESRS E5, its incoming material flows and the share of recycled or reused materials.
Unlike carbon, the circular economy has no single, universally recognized indicator framework: each company must choose what it measures and how. The group had no circularity indicators common to its divisions. It could therefore neither measure what its circular activities contribute to its objectives, nor meet the requirements of ESRS E5.
Our approach
The approach starts from the group’s circular strategy, not from the indicators available. The 2030 commitments were translated into a hierarchy: strategic objectives (avoided emissions, circular revenue), material flows, and enablers, such as ecodesign, that condition these flows.
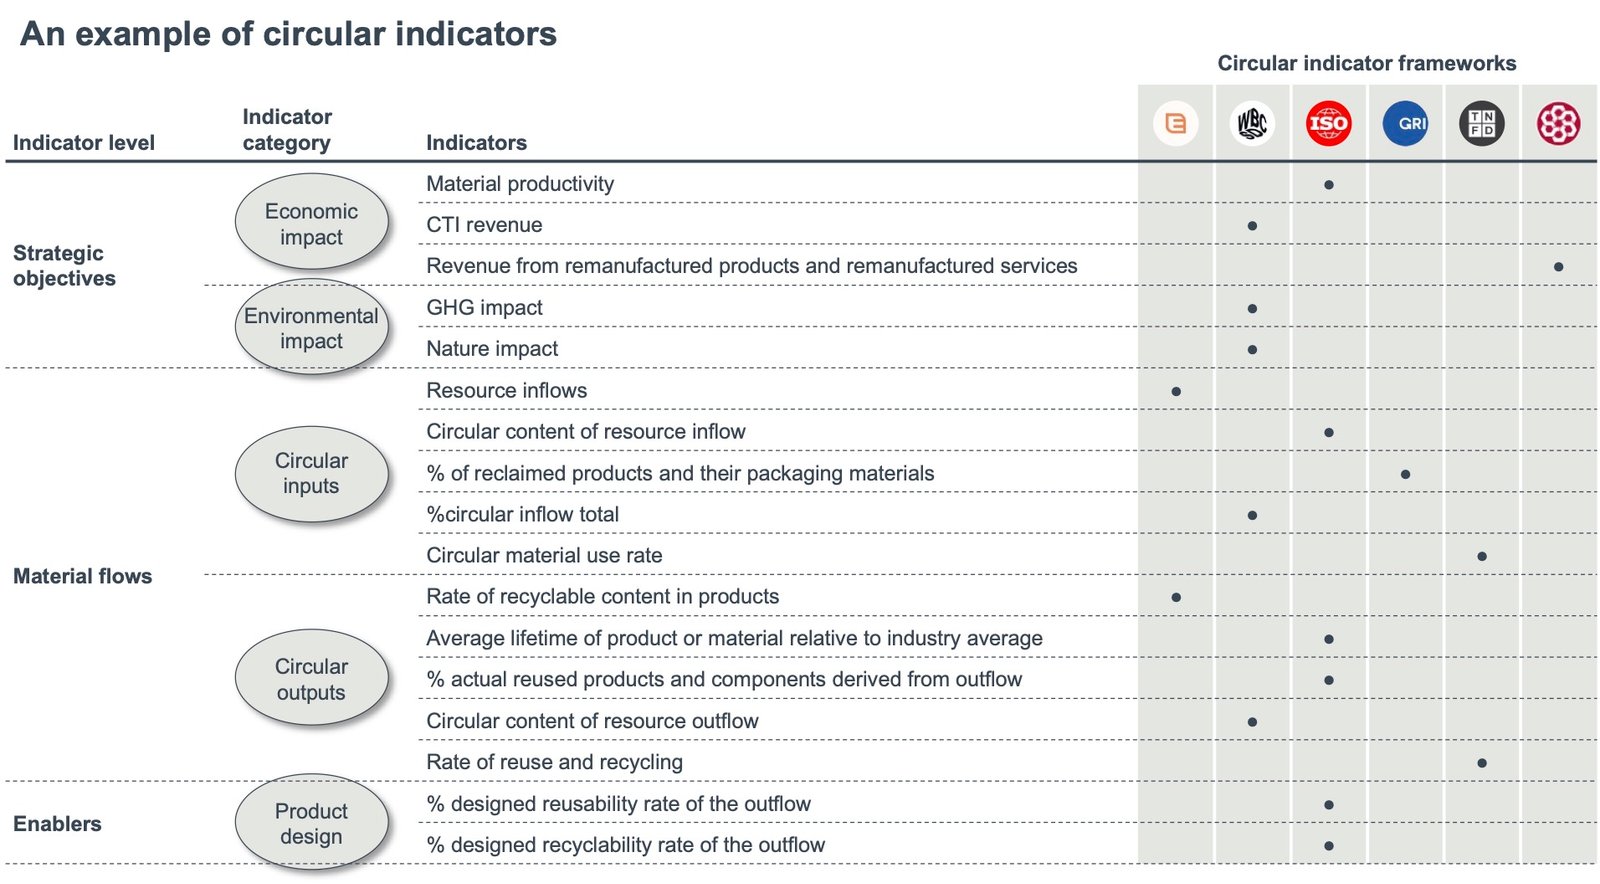
For each level, GATE C identified the circularity indicators proposed by existing frameworks: the WBCSD Circular Transition Indicators (v4.0), the ISO 59000 series, ESRS E5, and the frameworks of the Ellen MacArthur Foundation, the GRI and the TNFD.
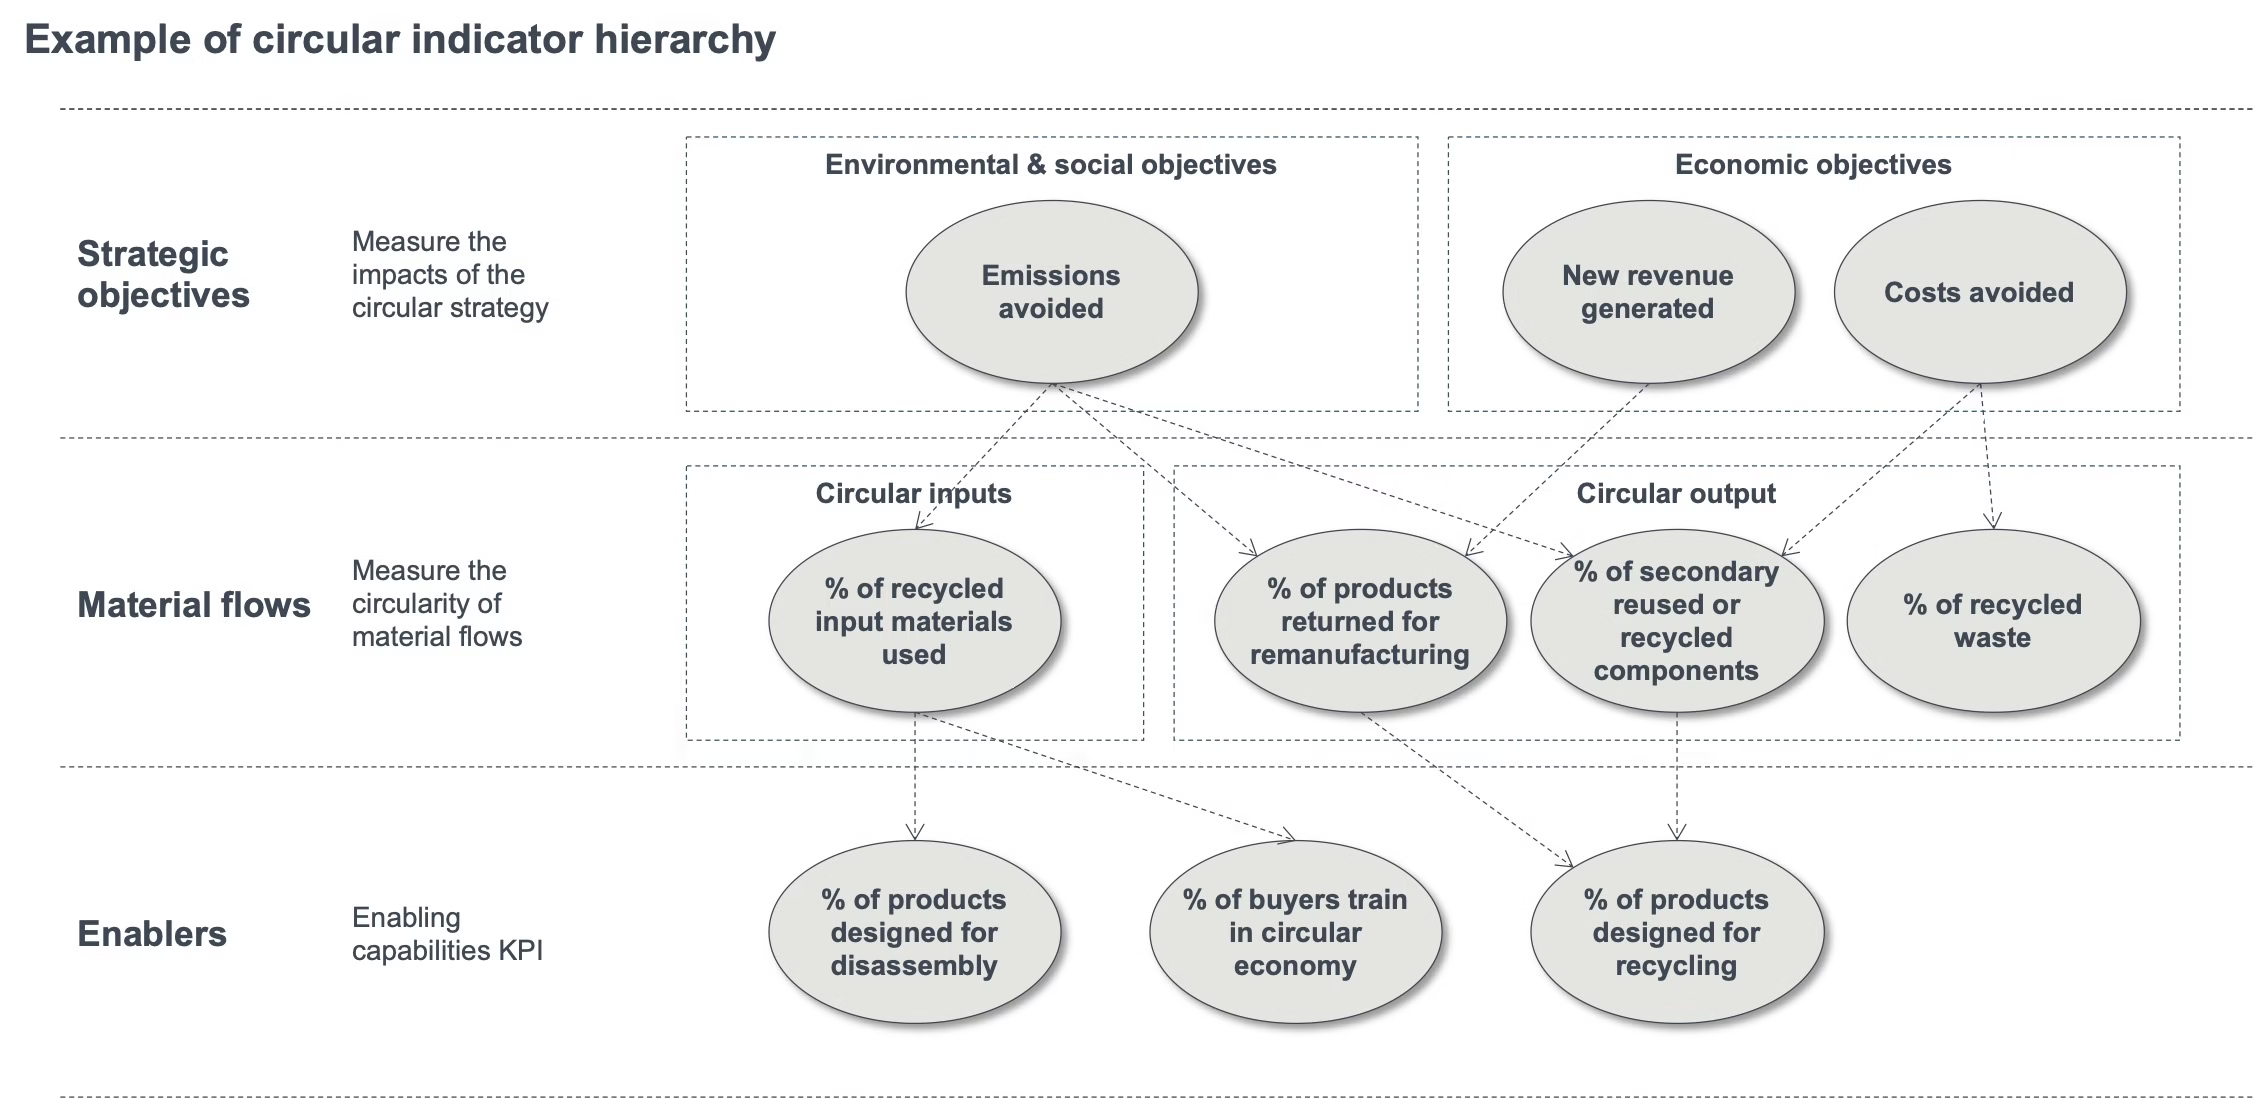
Each candidate indicator was then tested for data availability. Those that could not be calculated were discarded, starting with the outgoing flows indicator. Where data exists only in part, it is estimated: the recycled content of purchased parts is collected from a sample of suppliers and then extrapolated. Three indicators were retained, each defined by a formula, data inputs, an owner (about ten departments) and a collection method, across all regions, divisions and product families.
Results
- 3 indicators retained: circularity of incoming materials, share of circular revenue, and greenhouse gas emissions avoided through circular strategies. A fourth, on outgoing flows, was discarded for lack of calculable data.
- 35 data points defined, each with its internal source and collection method.
- The three indicators were validated by the Executive Committee. They are calculated and published every year with the sustainability report.
Connect with our circular economy consultants to know more